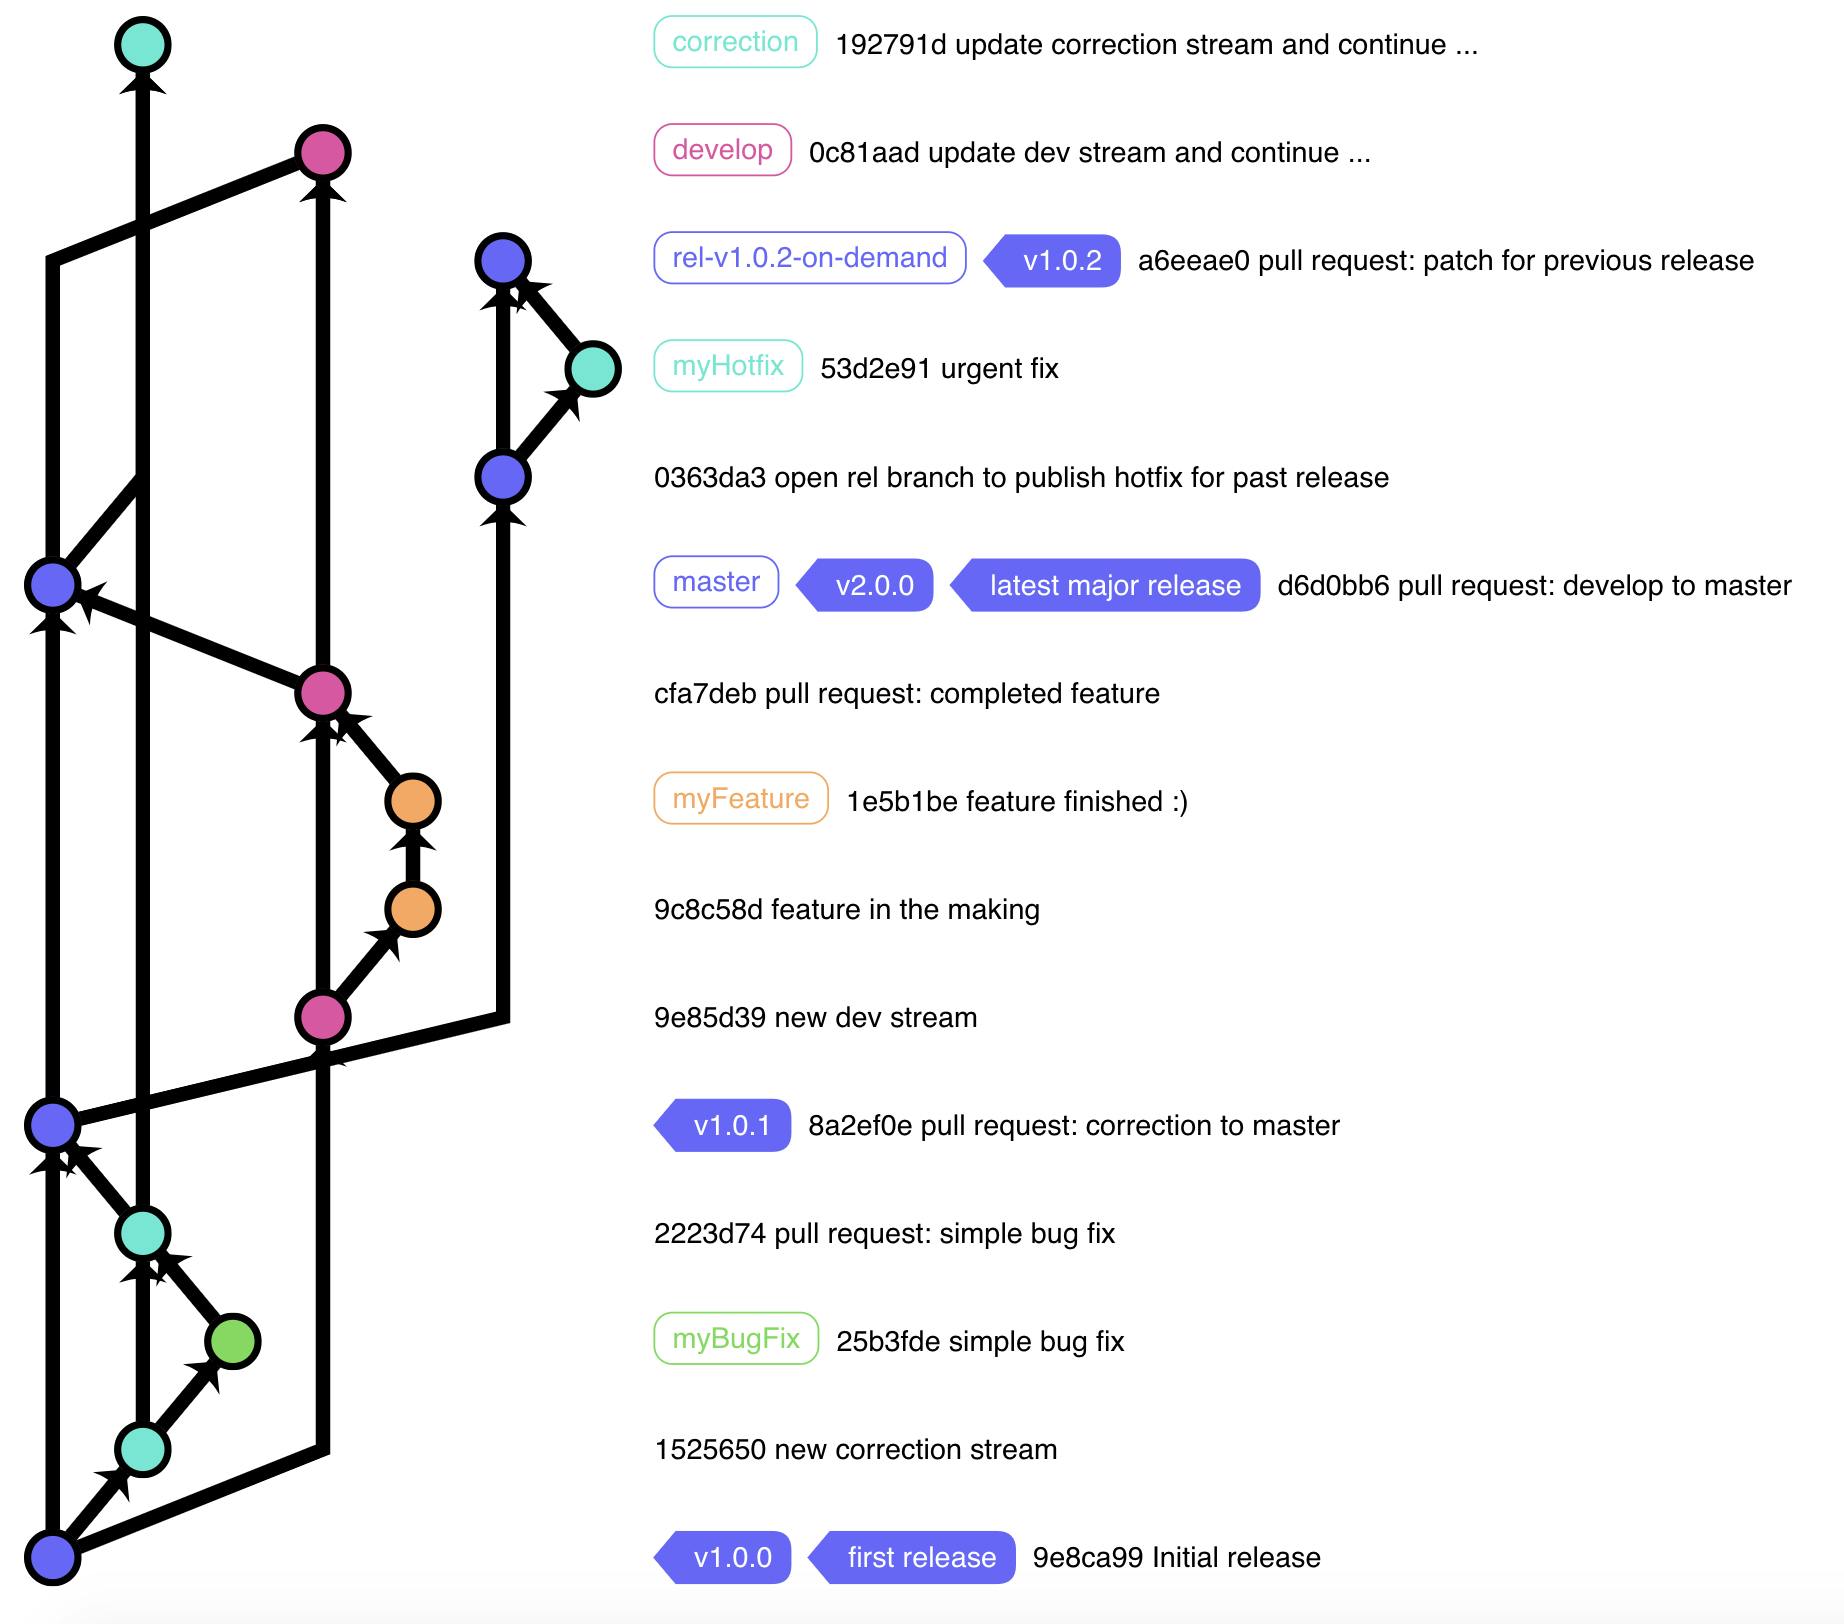
I find it easier to discuss branching and release strategies for git repositories with visual aid. Here is an example of a git graph:

You might think that looks really complex! How difficult is it to draw such graphs?!?
If you know JavaScript a bit (don't worry, you don't have to be an expert) then its quite easy thanks to GitGraph.js. This JavaScript library does all the heavy lifting and enables you to programmatically define the git graph which then gets rendered in the browser by the library.
I really dig their online documentation in form of a slide show.

My tip: use CodePen or any alternative online editor (which supports HTML/JS/CSS) to get started quickly. No unnecessary download of GitGraphJS as you can specify the use as an external script.
If you like this then please leave a star on this open-source project.

