Skip code during debugging in Xcode
I am a Software Engineer working on open source and enterprise mobile SDKs for iOS and MacOS developers written in Swift. From 🇩🇪 and happily living in 🇺🇸
In this blog post, I will explain how you can skip lines of code while debugging your iOS application in Xcode. I will use tips and tricks from the WWDC18 session Advanced Debugging with Xcode and LLDB and introduce alternatives.
Let's take the following simple example. A button may invoke a function with three print statements.
I want to skip the first statement.
Therefore I set a breakpoint on line 5, and I execute the following lldb command in the debugger console: thread jump --by 1
As you can see, only the print statements on line 6 and line 7 do get executed.
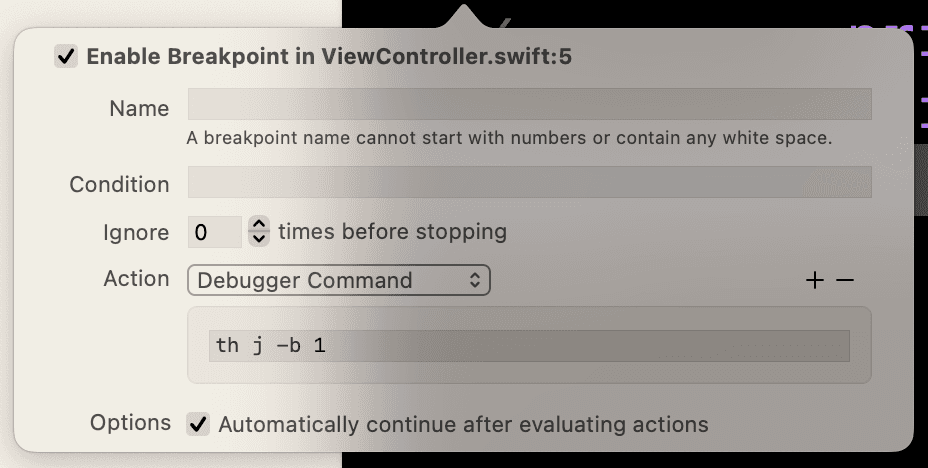
I can also use the short form th j -b 1 , which is identical to thread jump --by 1
Instead of entering the lldb command, I can move the instruction pointer in Xcode by dragging the highlighted green row.
But why even stop the debugger?
I can specify the debugger command as an action for the breakpoint and choose to automatically continue after the action got evaluated.
if you want to skip several rows, then you can still use thread jump --by and specify the number of rows to be skipped. But this can be cumbersome as you must count the rows you want to skip.
Instead of a relative move, I find it more beneficial to specify an absolute line number as the target to continue debugging.
Therefore you can use thread jump --line and specify the line number of the code to which you want to jump. The short version is th j -l
In my example, I want to skip the first two statements so only line 7 shall be executed. Hence I use th j -l 7
I told you that you can ignore the warning you see in the debugger console. So far, there have been no problems, but let me use two breakpoints, and each breakpoint has the debugger command th j -b 1.
The print statement on line 5 was skipped as expected, but the print statement on line 6 was still executed 😲. This is a surprise as you and I might expect that line 6 should also be skipped.
I cannot explain this with certainty, but the warning in the debugger console suggests that Xcode may not execute the breakpoint for line 6 as an alternative/duplicate implementation gets called.
If I break on line 5 and execute the debugger command th j -b 1 in the debugger console twice, only line 7 gets executed and everything worked as expected 🤯.
A fair warning: skipping code can be dangerous and may lead to crashes during your debugging.
A good example is if you jump over the initialization of some variable, you will be dealing with bad data now, and your program will likely crash.
You might be able to avoid such crashes by changing the location of your breakpoint or the number of lines to be skipped. I avoided the previous crash by setting the breakpoint to the first statement in my function.
Sometimes other techniques can also be used. For example, to skip an if statement, you can modify the variable content of the condition.
I wrote another blog post about that topic.
An alternative to skipping code is to remove the code, but only this change gets compiled. That's called hot reloading, and it's not that difficult. I wrote the following blog post about that topic.
Happy Debugging!